![[Tekos_Background] Do you know about rice score model?](https://tekos.net/wp-content/uploads/2024/07/Do-you-know-about-rice-score.png)
In the fast-paced world of product development, deciding which features to prioritize can be a challenging task. Enter RICE Scoring, a powerful and straightforward framework that helps product managers make data-driven decisions. It quantifies the potential value of different features, project ideas, and initiatives. By providing a clear and objective way to evaluate and compare options, RICE Scoring ensures that the most impactful projects get prioritized, maximizing the overall value delivered to users and stakeholders.
In this article, Tekos will explore what RICE Scoring is and practice a step-by-step guide to master your product prioritization.
So, what is RICE Scoring?
The RICE scoring framework was developed by the team at Intercom, a customer messaging platform, as a method for prioritizing features and ideas. Intercom introduced RICE scoring in their book “Intercom on Product Management” as a way to help product teams make informed decisions about what to build next.
The framework was created to address the need for a structured and data-driven approach to prioritize product features. It aims to provide a clear methodology that takes into account factors such as reach, impact, confidence, and effort, to determine the priority and feasibility of different features or ideas.
RICE, which stands for Reach, Impact, Confidence, and Effort, is a straightforward prioritization framework used to quantify the potential value of features, project ideas, and initiatives. By calculating a RICE score, product managers can estimate the value of a feature or project idea, making it easier to prioritize and determine the order of implementation.
The RICE score formula looks like this:
![[Tekos_Do you know about Rice Scoring?] The RICE score formula](https://tekos.net/wp-content/uploads/2024/06/rice-score-1024x256.png)
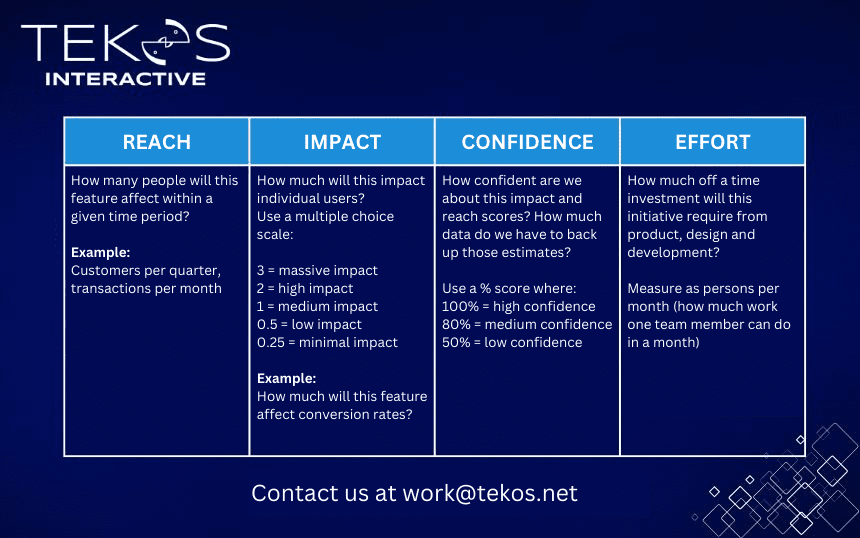
Reach
This factor assesses the number of people who will be impacted by the feature or idea. It considers the total number of users, potential users, or other stakeholders affected by the feature.
Impact
This factor measures how much the feature or idea will influence the success of your product, benefit the users or stakeholders. It takes into account metrics such as increased revenue or conversion rate, improved user experience, or increased efficiency.
- 3 = massive impact (XL)
- 2 = high impact (L)
- 1 = medium impact (M)
- 0.5 = low impact (S)
- 0.25 = minimal impact (XS)
Confidence
This factor represents the level of confidence the team has in their estimates of reach and impact. It considers factors such as data quality, market knowledge, or experience with similar features.
- 100% = high confidence
- 80% = medium confidence
- 50% = low confidence
Effort
This factor represents the amount of work required to complete a task or implement a feature. It is typically measured in person-hours, person-days, or person-weeks, and it helps to estimate the resources needed for the project.
Let’s practice!
For example: Suppose you work for a software company developing a task management mobile app. The product team is considering adding three new features and needs to decide which one to prioritize.
- Attach events into timeline
- Create Push Notifications
- Switch Mode for the App
RICE Evaluation
Attach events into timeline
Reach: 100 users per month (number of active users who could use this feature).
Impact: 3 (the minimum impact suppose scale from 1 to 5).
Confidence: 90% (the team is very confident this will have the expected impact).
Effort: 30 (human-days required to develop the feature).
RICE Score = (Reach x Impact x Confidence) / Effort = (100 x 3 x 0.9) / 30 = 9
Create Push Notifications
Reach: 80 users per month
Impact: 4 (high impact)
Confidence: 80%
Effort: 20RICE Score = (Reach x Impact x Confidence) / Effort = (80 x 4 x 0.8) / 20 = 12.8
Switch Mode for the App
Reach: 50 users per month
Impact: 2 (high impact)
Confidence: 95%
Effort: 10
RICE Score = (Reach x Impact x Confidence) / Effort = (50 x 2 x 0.95) / 10 = 9.5
Final calculation
Based on the RICE scores, here is the priority order for the features:
Create Push Notifications (Score: 12,800)
Switch Mode for the App (Score: 9,500)
Attach events into timeline (Score: 9,000)
Pros and cons of RICE scoring
Pros
- Shows a more comprehensive picture: RICE includes several versatile factors to show project managers the bigger picture. The score is based on data instead of emotions.
- Actionable Metrics: This feature prioritization technique is mostly based on actual data and KPIs, which can be used to make accurate estimates.
- Valuable to Customer: Because RICE uses metrics rooted in user engagement, it also takes into account user satisfaction. In other words, the user experience is a central component of the RICE method.
- Built for Scalability: RICE applies an individual score to each potential product feature. As such, this framework becomes more useful as your potential feature list swells. If RICE might seem like overkill on a backlog with five features, it could easily become a life-saver on products with eighty.
Cons
- It’s time-consuming: RICE requires analyzing potential features across four different metrics. As such, product managers are tasked with considering potential outcomes before given features have seen the light of day.
- The data isn’t always available: While reach and impact are metrics well worth chasing, for all but the most mature products, they’re also often difficult to measure. While the proper RICE answer would be to lower your confidence score accordingly, this could result in an amazing feature never being released because its score won’t bubble up to the top.
- Discipline is critical: As mentioned previously, RICE is an equation that derives from four different inputs. If you fail to calculate any of the individual metrics uniquely across even two potential features, your results inherently become flawed. Thus, RICE succeeds the most where it’s deployed the most
- Error margin is difficult to appreciate. It is therefor difficult to estimate the reality of the scoring and can only be considered a helping hand rather than a deterministic approach.
Conclusions
RICE aims to reduce biases by focusing on reach rather than squeaky wheels. It further reduces biases by measuring confidence and seeking data and validation in prioritization.
RICE also encourages product management best practices, such as discovery to increase confidence, supporting decisions with data, focusing on impact, and striving for customer centricity through reach.
Would you like to read more articles by Tekos’s Team? Everything’s here.
References
– RICE: Simple prioritization for product managers
– 9 product prioritization frameworks for product managers
– RICE score: A prioritization framework for estimating the value of ideas
– RICE Scoring & Framework Explained