
While techniques like console.log have traditionally been used to track the number of renders and measure rendering time in React applications, it’s important to be aware of more robust solutions, it’s important to be aware of a more robust solution: the Profiler component.
What is the React Profiler?
You can interact with the React Profiler API in two ways: The React Devtools extension or the Profiler Component. But in this article, I only focus on The Profiler Component of Devtools extension. I will introduce this in the next part.
According to the React document:
- The Profiler measures how often a React application renders and what the “cost” of rendering is.
- Its purpose is to help identify parts of an application that are slow and may benefit from optimizations such as memoization.
- It enables you to keep track of each component’s performance data and rendering times.
Why should you use the React Profiler?
In React applications, when a component is re-rendered, it also, in turn, re-renders all of its descendants. In most cases, this re-rendering shouldn’t cause performance issues, and we shouldn’t notice any lag in our application. However, if the unaffected component renders an expensive computation and we notice performance issues, then we should optimize our React application.
Once you start using React Profiler, you’ll gain valuable insights into your application’s performance. By identifying components that are re-rendering unnecessarily, you can focus your optimization efforts. The Profiler not only helps you pinpoint these culprits, but it also allows you to measure the rendering times of individual components, making it clear which areas need the most attention for a performance boost.
Example:
import { useState } from 'react';

        const list = Array.from({ length: 10000}, (v, k)=> k += 1);
        const ListComponent = function ListComponent () {
        return (
<>
Number:
        {
        list.map((num) (<div key={num}>{num}</div>))
        );
        };
        const App = () = {
        const [name, setName] = useState<string>('');
        return (
<>
<input onChange={(e) setName(e.target.value)} />
<div className="name">
        Name:
        {
        name
        }
</div>
<ListComponent />
</>
        );
        }

        export default App;
App.tsx contains ListComponent. When we update the name by typing text in the input field, Rect updates the entire component tree under App.tsx including ListComponent.
Note that <ListComponent /> has no dependency on App.js. But ListComponent re-renders whenever the name changes. ListComponent renders large lists, and unnecessary re-renders impact the application performance. Using a profiler in App.tsx measures the cost and number rendered to improve performance.
Let’s have a quick introduction on how to use the React Profiler
A Profiler can be added anywhere in a React tree to measure the cost of rendering that part of the tree. It requires two props: an id (string) and an onRender callback (function) which React calls any time a component within the tree “commits” an update.
Adding a profiler to our App
To profile an App component and its descendants:
const App () => {
 const [name, setName] = useState<string>('');

 return (
    <Profiler
      id="App"
      onRender={(id, phase, actualDuration, baseDuration, startTime, commitTime) => {
          console.log('${id}'s ${phase) phase:`);
          console.log('Actual time: ${actualDuration}`);
          console.log('Base time: $(baseDuration}`);
          console.log('Start time: ${startTime}');
          console.log('Commit time: ${commitTime}`);
       }}
>

       <input onChange={(e) => setName(e.target.value)} />
       <div className="name">
           Name:
           {
             name
           }
      </div>
      <ListComponent />
    </Profiler>
   );
}
In this onRender function, we log an object with these five arguments to the console. And this gives us all the performance information we need as seen in the image below:
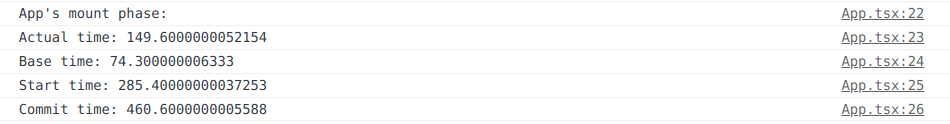
Properties in details
The meaning of each of these arguments:
- id: The string id prop of the <Profiler> tree that has just committed. This lets you identify which part of the tree was committed if you are using multiple profiles.
- phase: “mount”, “update” or “nested-update”. React Profiler empowers you to understand exactly when a component renders. It differentiates between an initial mount and subsequent re-renders triggered by changes in props, state, or hooks.ooks.
- actualDuration: The number of milliseconds spent rendering the <Profiler> and its descendants for the current update. This indicates how well the subtree makes use of memoization (e.g. memo and useMemo). Ideally, this value should decrease significantly after the initial mount as many of the descendants will only need to re-render if their specific props change.
- baseDuration: The number of milliseconds estimating how much time it would take to re-render the entire <Profiler> subtree without any optimizations. It is calculated by summing up the most recent render durations of each component in the tree. This value estimates a worst-case cost of rendering (e.g. the initial mount or a tree with no memorization). Compare actualDuration against it to see if memoization is working.
- startTime: A numeric timestamp for when React began rendering the current update.
- endTime: A numeric timestamp for when React committed the current update. This value is shared between all profilers in a commit, enabling them to be grouped if desired.
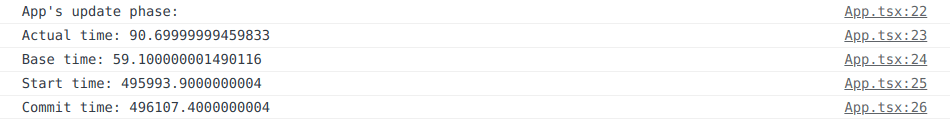
In the real world, instead of logging them to the console, you would probably be sending them to your backend to get useful aggregate charts.
View the result when you update the name and make the App.tsx re-renders:
Improve and iterate
Try improving the code with the memo. Wrap ListComponent in the memo to get a memoized version:
import {
    useState,
    Profiler,
    memo
} from 'react';
const list = Array.from({
    length: 10000
}, (v, k) => k += 1);
const ListComponent = memo(function ListComponent() {
            return ( <
                >
                Number: {
                    list.map((num)( < div key = {
                                num
                            } > {
                                num
                            } < /div>))
                        } <
                        />
                    );
                });
            const App = () => {
                    const [name, setName] = useState < string > ('');
                    return ( <
                            Profiler id = "App"
                            onRender = {
                                (id, phase, actualDuration, baseDuration, startTime, commitTime) => {
                                    console.log('${id}'
                                            s $ {
                                                phase) phase: ');
                                            console.log('Actual time: ${actualDuration}'); console.log('Base time: ${baseDuration}`);
                                                console.log('Start time: ${startTime));
                                                    console.log('Commit time: ${commitTime}`); {}
                                                    } >
                                                    <
                                                    input onChange = {
                                                        (e) => setName(e.target.value)
                                                    } <
                                                    div className = "name" >
                                                    Name: {
                                                        name <
                                                        /div> <
                                                        ListComponent / >
                                                        <
                                                        /Profiler>
                                                    );
                                                }
                                                export default App;
Typing a name and view the results in the console:
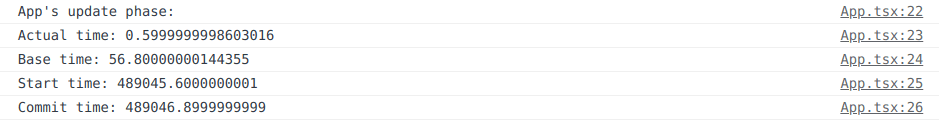
Limited re-renders of heavy components directly attack the cost of rendering, leading to a significant performance improvement.
As a side note
Although <Profiler> is a lightweight component, it should be used only when necessary. Each use adds some CPU and memory overhead to an application. However, if you need it badly, you can get instructions on how to use it in production here.
In the test
export const profile = (Component) => {
        const handleRender = (
            id, // the "id" prop of the Profiler tree that has just committed
            phase, // either "mount" (if the tree just mounted) or "update" (if it re-rendered)
            actualDuration, // time spent rendering the committed update
            baseDuration, // estimated time to render the entire subtree without memoization
            startTime, // when React began rendering this update
            commitTime, // when React committed this update
            interactions
        ) => {
            ProfiledComponent.updates.push({
                id,
                phase,
                actualDuration,
                baseDuration,
                startTime,
                commitTime,
                interactions,
            });
        };
        const ProfiledComponent = (props) => ( <
                Profiler id = {
                    `Profiled${Component.name || 'UnknownComponent`}`}
onRender={handleRender}
<Component {...props} />
</Profiler>
);
ProfiledComponent.updates = [];
ProfiledComponent.commitCount = () => Profiled Component.updates.length;
ProfiledComponent.updateCount = () =>
ProfiledComponent.updates.filter((c) => c.phase === "update").length;
return ProfiledComponent;
};
Create the HOC
Use in test case
import React from "react";
import {
	fireEvent,
	render
} from "@testing-library/react";
import {
	profile
} from "./ReactProfiler";
import App from "./App";
test("renders learn react link", () => {
			const ProfiledApp = profile(App);
			const {
				getByText = render( < ProfiledApp / > );
				const btn = getByText(/Increment/i);
				fireEvent.click(btn);
				fireEvent.click(btn);
				fireEvent.click(btn);
				fireEvent.click(btn);
				expect(ProfiledApp.commitCount()).toBe(5); // counts updates + mount phases
				expect(ProfiledApp.updateCount()).toBe(4); // counts only the update phases
				expect(getByText(/4/
					1)).toBeInTheDocument();
			});
In conclusion
To successfully optimize our React application, we must first find performance problems and this is exactly what the profiler is for. In conclusion, React Profiler is a tool you should think about utilizing if you want to maximize the performance of your React application.
Would you like to read more articles by Tekos’s Team? Everything’s here.
Reference
- https://chrome.google.com/webstore/detail/react-developer-tools/fmkadmapgofadopljbjfkapdkoienihi?hl=en
- https://react.dev/reference/react/Profiler
- https://react.dev/reference/react/memo
- https://gist.github.com/bvaughn/25e6233aeb1b4f0cdb8d8366e54a3977
- https://legacy.reactjs.org/docs/higher-order-components.html